本文最后更新于:July 15, 2022 am
1
2
3
import pandas as pdimport numpy as npfrom mpl_toolkits.mplot3d import Axes3D
1 life = pd.read_csv('C:/Users/86155/Desktop/Life Expectancy Data.csv' )
Country
Year
Status
Life expectancy
Adult Mortality
infant deaths
Alcohol
percentage expenditure
Hepatitis B
Measles
...
Polio
Total expenditure
Diphtheria
HIV/AIDS
GDP
Population
thinness 1-19 years
thinness 5-9 years
Income composition of resources
Schooling
0
Afghanistan
2015
Developing
65.0
263.0
62
0.01
71.279624
65.0
1154
...
6.0
8.16
65.0
0.1
584.259210
33736494.0
17.2
17.3
0.479
10.1
1
Afghanistan
2014
Developing
59.9
271.0
64
0.01
73.523582
62.0
492
...
58.0
8.18
62.0
0.1
612.696514
327582.0
17.5
17.5
0.476
10.0
2
Afghanistan
2013
Developing
59.9
268.0
66
0.01
73.219243
64.0
430
...
62.0
8.13
64.0
0.1
631.744976
31731688.0
17.7
17.7
0.470
9.9
3
Afghanistan
2012
Developing
59.5
272.0
69
0.01
78.184215
67.0
2787
...
67.0
8.52
67.0
0.1
669.959000
3696958.0
17.9
18.0
0.463
9.8
4
Afghanistan
2011
Developing
59.2
275.0
71
0.01
7.097109
68.0
3013
...
68.0
7.87
68.0
0.1
63.537231
2978599.0
18.2
18.2
0.454
9.5
5 rows × 22 columns
1
2
import matplotlib.pyplot as pltimport seaborn as sns
Year
Life expectancy
Adult Mortality
infant deaths
Alcohol
percentage expenditure
Hepatitis B
Measles
BMI
under-five deaths
Polio
Total expenditure
Diphtheria
HIV/AIDS
GDP
Population
thinness 1-19 years
thinness 5-9 years
Income composition of resources
Schooling
count
2938.000000
2928.000000
2928.000000
2938.000000
2744.000000
2938.000000
2385.000000
2938.000000
2904.000000
2938.000000
2919.000000
2712.00000
2919.000000
2938.000000
2490.000000
2.286000e+03
2904.000000
2904.000000
2771.000000
2775.000000
mean
2007.518720
69.224932
164.796448
30.303948
4.602861
738.251295
80.940461
2419.592240
38.321247
42.035739
82.550188
5.93819
82.324084
1.742103
7483.158469
1.275338e+07
4.839704
4.870317
0.627551
11.992793
std
4.613841
9.523867
124.292079
117.926501
4.052413
1987.914858
25.070016
11467.272489
20.044034
160.445548
23.428046
2.49832
23.716912
5.077785
14270.169342
6.101210e+07
4.420195
4.508882
0.210904
3.358920
min
2000.000000
36.300000
1.000000
0.000000
0.010000
0.000000
1.000000
0.000000
1.000000
0.000000
3.000000
0.37000
2.000000
0.100000
1.681350
3.400000e+01
0.100000
0.100000
0.000000
0.000000
25%
2004.000000
63.100000
74.000000
0.000000
0.877500
4.685343
77.000000
0.000000
19.300000
0.000000
78.000000
4.26000
78.000000
0.100000
463.935626
1.957932e+05
1.600000
1.500000
0.493000
10.100000
50%
2008.000000
72.100000
144.000000
3.000000
3.755000
64.912906
92.000000
17.000000
43.500000
4.000000
93.000000
5.75500
93.000000
0.100000
1766.947595
1.386542e+06
3.300000
3.300000
0.677000
12.300000
75%
2012.000000
75.700000
228.000000
22.000000
7.702500
441.534144
97.000000
360.250000
56.200000
28.000000
97.000000
7.49250
97.000000
0.800000
5910.806335
7.420359e+06
7.200000
7.200000
0.779000
14.300000
max
2015.000000
89.000000
723.000000
1800.000000
17.870000
19479.911610
99.000000
212183.000000
87.300000
2500.000000
99.000000
17.60000
99.000000
50.600000
119172.741800
1.293859e+09
27.700000
28.600000
0.948000
20.700000
<class 'pandas.core.frame.DataFrame'>
RangeIndex: 2938 entries, 0 to 2937
Data columns (total 22 columns):
 #   Column                           Non-Null Count  Dtype
---  ------                           --------------  -----
 0   Country                          2938 non-null   object
 1   Year                             2938 non-null   int64
 2   Status                           2938 non-null   object
 3   Life expectancy                  2928 non-null   float64
 4   Adult Mortality                  2928 non-null   float64
 5   infant deaths                    2938 non-null   int64
 6   Alcohol                          2744 non-null   float64
 7   percentage expenditure           2938 non-null   float64
 8   Hepatitis B                      2385 non-null   float64
 9   Measles                          2938 non-null   int64
 10   BMI                             2904 non-null   float64
 11  under-five deaths                2938 non-null   int64
 12  Polio                            2919 non-null   float64
 13  Total expenditure                2712 non-null   float64
 14  Diphtheria                       2919 non-null   float64
 15   HIV/AIDS                        2938 non-null   float64
 16  GDP                              2490 non-null   float64
 17  Population                       2286 non-null   float64
 18   thinness  1-19 years            2904 non-null   float64
 19   thinness 5-9 years              2904 non-null   float64
 20  Income composition of resources  2771 non-null   float64
 21  Schooling                        2775 non-null   float64
dtypes: float64(16), int64(4), object(2)
memory usage: 505.1+ KB
Country                              0
Year                                 0
Status                               0
Life expectancy                     10
Adult Mortality                     10
infant deaths                        0
Alcohol                            194
percentage expenditure               0
Hepatitis B                        553
Measles                              0
 BMI                                34
under-five deaths                    0
Polio                               19
Total expenditure                  226
Diphtheria                          19
 HIV/AIDS                            0
GDP                                448
Population                         652
 thinness  1-19 years               34
 thinness 5-9 years                 34
Income composition of resources    167
Schooling                          163
dtype: int64
1 2 3 4 5 6 from sklearn.impute import SimpleImputer'median' )3 :])3 :]=imputer.transform(life.iloc[:, 3 :])
Country 0
Year 0
Status 0
Life expectancy 10
Adult Mortality 0
infant deaths 0
Alcohol 0
percentage expenditure 0
Hepatitis B 0
Measles 0
BMI 0
under-five deaths 0
Polio 0
Total expenditure 0
Diphtheria 0
HIV/AIDS 0
GDP 0
Population 0
thinness 1-19 years 0
thinness 5-9 years 0
Income composition of resources 0
Schooling 0
dtype: int64
Year
Life expectancy
Adult Mortality
infant deaths
Alcohol
percentage expenditure
Hepatitis B
Measles
BMI
under-five deaths
Polio
Total expenditure
Diphtheria
HIV/AIDS
GDP
Population
thinness 1-19 years
thinness 5-9 years
Income composition of resources
Schooling
count
2938.000000
2938.000000
2938.000000
2938.000000
2938.000000
2938.000000
2938.000000
2938.000000
2938.000000
2938.000000
2938.000000
2938.000000
2938.000000
2938.000000
2938.000000
2.938000e+03
2938.000000
2938.000000
2938.000000
2938.000000
mean
2007.518720
69.234717
164.725664
30.303948
4.546875
738.251295
83.022124
2419.592240
38.381178
42.035739
82.617767
5.924098
82.393125
1.742103
6611.523863
1.023085e+07
4.821886
4.852144
0.630362
12.009837
std
4.613841
9.509115
124.086215
117.926501
3.921946
1987.914858
22.996984
11467.272489
19.935375
160.445548
23.367166
2.400770
23.655562
5.077785
13296.603449
5.402242e+07
4.397621
4.485854
0.205140
3.265139
min
2000.000000
36.300000
1.000000
0.000000
0.010000
0.000000
1.000000
0.000000
1.000000
0.000000
3.000000
0.370000
2.000000
0.100000
1.681350
3.400000e+01
0.100000
0.100000
0.000000
0.000000
25%
2004.000000
63.200000
74.000000
0.000000
1.092500
4.685343
82.000000
0.000000
19.400000
0.000000
78.000000
4.370000
78.000000
0.100000
580.486996
4.189172e+05
1.600000
1.600000
0.504250
10.300000
50%
2008.000000
72.100000
144.000000
3.000000
3.755000
64.912906
92.000000
17.000000
43.500000
4.000000
93.000000
5.755000
93.000000
0.100000
1766.947595
1.386542e+06
3.300000
3.300000
0.677000
12.300000
75%
2012.000000
75.600000
227.000000
22.000000
7.390000
441.534144
96.000000
360.250000
56.100000
28.000000
97.000000
7.330000
97.000000
0.800000
4779.405190
4.584371e+06
7.100000
7.200000
0.772000
14.100000
max
2015.000000
89.000000
723.000000
1800.000000
17.870000
19479.911610
99.000000
212183.000000
87.300000
2500.000000
99.000000
17.600000
99.000000
50.600000
119172.741800
1.293859e+09
27.700000
28.600000
0.948000
20.700000
Country
Year
Status
Life expectancy
Adult Mortality
infant deaths
Alcohol
percentage expenditure
Hepatitis B
Measles
...
Polio
Total expenditure
Diphtheria
HIV/AIDS
GDP
Population
thinness 1-19 years
thinness 5-9 years
Income composition of resources
Schooling
0
Afghanistan
2015
Developing
65.0
263.0
62.0
0.01
71.279624
65.0
1154.0
...
6.0
8.16
65.0
0.1
584.259210
33736494.0
17.2
17.3
0.479
10.1
1
Afghanistan
2014
Developing
59.9
271.0
64.0
0.01
73.523582
62.0
492.0
...
58.0
8.18
62.0
0.1
612.696514
327582.0
17.5
17.5
0.476
10.0
2
Afghanistan
2013
Developing
59.9
268.0
66.0
0.01
73.219243
64.0
430.0
...
62.0
8.13
64.0
0.1
631.744976
31731688.0
17.7
17.7
0.470
9.9
3
Afghanistan
2012
Developing
59.5
272.0
69.0
0.01
78.184215
67.0
2787.0
...
67.0
8.52
67.0
0.1
669.959000
3696958.0
17.9
18.0
0.463
9.8
4
Afghanistan
2011
Developing
59.2
275.0
71.0
0.01
7.097109
68.0
3013.0
...
68.0
7.87
68.0
0.1
63.537231
2978599.0
18.2
18.2
0.454
9.5
5 rows × 22 columns
1 2 3 True )
Index(['Country', 'Year', 'Status', 'Life expectancy ', 'Adult Mortality',
'infant deaths', 'Alcohol', 'percentage expenditure', 'Hepatitis B',
'Measles ', ' BMI ', 'under-five deaths ', 'Polio', 'Total expenditure',
'Diphtheria ', ' HIV/AIDS', 'GDP', 'Population',
' thinness 1-19 years', ' thinness 5-9 years',
'Income composition of resources', 'Schooling'],
dtype='object')
1 2 a = life[['Country' , 'Year' , 'Status' , 'Life expectancy ' , 'Adult Mortality' ,'infant deaths' ]]
<seaborn.axisgrid.PairGrid at 0x1387c388bb0>
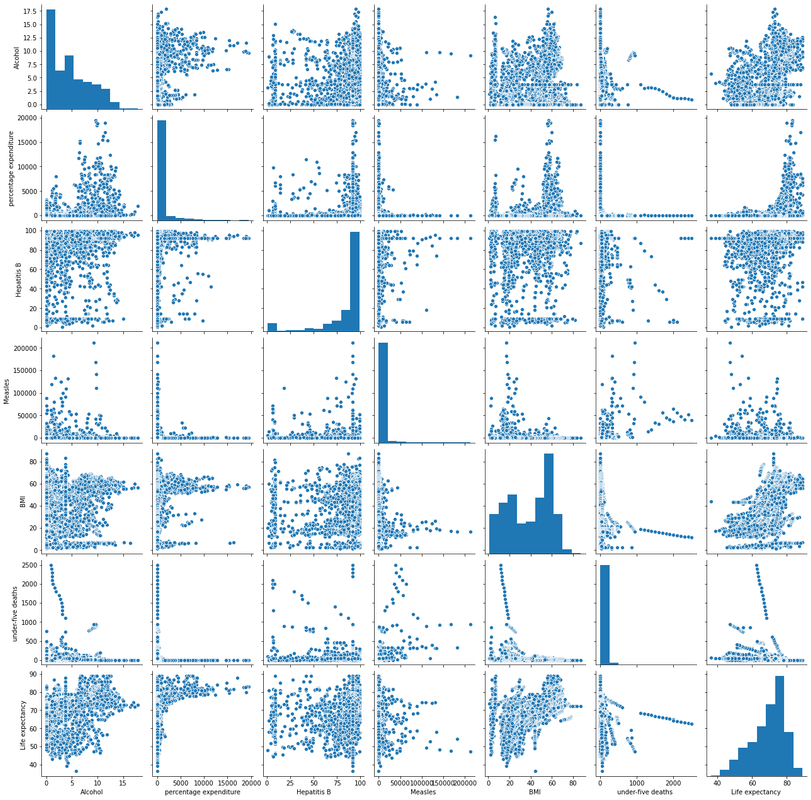
1 2 b = life[['Alcohol' , 'percentage expenditure' , 'Hepatitis B' ,'Measles ' , ' BMI ' , 'under-five deaths ' , 'Life expectancy ' ]]
<seaborn.axisgrid.PairGrid at 0x1387d22be80>
1 c = life[[ 'Polio' , 'Total expenditure' ,'Diphtheria ' , ' HIV/AIDS' , 'GDP' , 'Life expectancy ' ]]
<seaborn.axisgrid.PairGrid at 0x1387d305fd0>
1 2 3 e = life[['Population' ,' thinness 1-19 years' , ' thinness 5-9 years' ,'Income composition of resources' , 'Schooling' ,'Life expectancy ' ]]
<seaborn.axisgrid.PairGrid at 0x13803724460>
1 2 plt.figure(figsize=(16 , 16 ))True )
<matplotlib.axes._subplots.AxesSubplot at 0x138076038b0>
1 2 3 4 'percentage expenditure' ].median()
64.912906045
1 o = life.loc[life['Life expectancy ' ] <65 ]
Country
Year
Status
Life expectancy
Adult Mortality
infant deaths
Alcohol
percentage expenditure
Hepatitis B
Measles
...
Polio
Total expenditure
Diphtheria
HIV/AIDS
GDP
Population
thinness 1-19 years
thinness 5-9 years
Income composition of resources
Schooling
1
Afghanistan
2014
Developing
59.9
271.0
64
0.01
73.523582
62.0
492
...
58.0
8.18
62.0
0.1
612.696514
327582.0
17.5
17.5
0.476
10.0
2
Afghanistan
2013
Developing
59.9
268.0
66
0.01
73.219243
64.0
430
...
62.0
8.13
64.0
0.1
631.744976
31731688.0
17.7
17.7
0.470
9.9
3
Afghanistan
2012
Developing
59.5
272.0
69
0.01
78.184215
67.0
2787
...
67.0
8.52
67.0
0.1
669.959000
3696958.0
17.9
18.0
0.463
9.8
4
Afghanistan
2011
Developing
59.2
275.0
71
0.01
7.097109
68.0
3013
...
68.0
7.87
68.0
0.1
63.537231
2978599.0
18.2
18.2
0.454
9.5
5
Afghanistan
2010
Developing
58.8
279.0
74
0.01
79.679367
66.0
1989
...
66.0
9.20
66.0
0.1
553.328940
2883167.0
18.4
18.4
0.448
9.2
5 rows × 22 columns
Year
Life expectancy
Adult Mortality
infant deaths
Alcohol
percentage expenditure
Hepatitis B
Measles
BMI
under-five deaths
Polio
Total expenditure
Diphtheria
HIV/AIDS
GDP
Population
thinness 1-19 years
thinness 5-9 years
Income composition of resources
Schooling
count
851.000000
851.000000
851.000000
851.000000
851.000000
851.000000
851.000000
851.000000
851.000000
851.000000
851.000000
851.000000
851.000000
851.000000
851.000000
8.510000e+02
851.000000
851.00000
851.000000
851.000000
mean
2006.819036
56.717979
282.206816
64.045828
2.732844
72.750935
76.294947
4755.605170
22.198590
94.283196
66.230317
5.382127
65.615746
5.493537
1148.534646
1.212722e+07
7.688484
7.66839
0.438837
8.830787
std
4.564844
5.618431
150.316652
169.930696
2.727926
168.242431
24.938488
16995.691061
11.521692
235.109718
26.326655
2.129323
27.054876
8.290629
1963.526909
7.028048e+07
4.359019
4.49745
0.160284
2.647701
min
2000.000000
36.300000
2.000000
0.000000
0.010000
0.000000
1.000000
0.000000
2.100000
0.000000
3.000000
0.650000
2.000000
0.100000
3.685949
1.679000e+03
0.200000
0.20000
0.000000
0.000000
25%
2003.000000
52.700000
228.500000
7.000000
0.365000
1.792246
71.000000
13.500000
15.900000
10.000000
54.000000
3.970000
51.000000
0.800000
263.129142
7.237965e+05
5.600000
5.50000
0.388000
7.200000
50%
2006.000000
57.500000
285.000000
27.000000
1.830000
22.097580
88.000000
245.000000
19.500000
42.000000
73.000000
5.300000
74.000000
2.500000
561.997387
1.386542e+06
7.700000
7.50000
0.451000
9.100000
75%
2011.000000
61.800000
366.000000
56.500000
4.150000
62.523467
92.000000
1902.000000
26.800000
88.000000
86.000000
6.410000
86.000000
5.800000
1766.947595
7.078446e+06
9.300000
9.20000
0.514000
10.600000
max
2015.000000
64.900000
723.000000
1800.000000
11.890000
1705.678619
99.000000
212183.000000
72.100000
2500.000000
99.000000
14.390000
99.000000
50.600000
22742.381590
1.161978e+09
27.700000
28.60000
0.741000
14.400000
1 2 3 4 16 , 13 ))True )
<matplotlib.axes._subplots.AxesSubplot at 0x209b4a9afa0>
1 2 3 4 5 plt.figure(figsize=(30 ,7 ))'Adult Mortality' ,data = o.head(5 ), hue = 'Life expectancy ' ,palette='PuBuGn' ,saturation=0.8 )13 )13 )
1 2 3 4 5 x = o[['Adult Mortality' ]]'Life expectancy ' ]]700 ,420 ))
1 2 3 4 5 6 7 8 9 10 11 12 13 14 'Adult Mortality' ].values'Life expectancy ' ].valueslen (X)0 0 for i in range (l):2 print (b1,b0)
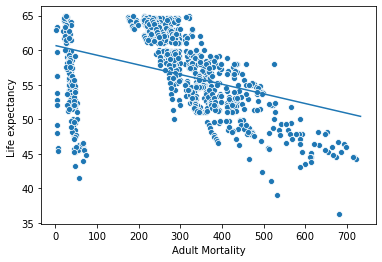
-0.013979330333748737 60.66304114487947
1 2 3 4 5 6 7 max_x=np.max (X)+10 min (X)"Adult Mortality" ],y=o["Life expectancy " ])
<matplotlib.axes._subplots.AxesSubplot at 0x1380d8a03d0>